DATA MANAGEMENT
SMART FLOW includes a set of tools for simulation model data management (data edition, advanced visualization of results on single-line diagrams, conversion from/to standard formats, etc.) and a Batch Tool, a powerful macro recorder allowing the user to easily define a batch of computations. A powerful Model Editor allows for the creation of user-defined dynamic models.
Editing simulation data
A dedicated module (File Editor) is devoted to the edition of all simulation data: the load-flow data (topology, load, generation, network parameters, etc.), the dynamic data (characteristics of generators and motors, type and parameters of the controllers, nature of the loads, the protection schemes) and the parameters of the simulated events (time of events, type of short-circuit, tripping, open/close of breakers, change of the transformer tap position, load modification, etc.).
Incremental modelling
Incremental files, defining changes in the topology, parameters or operating conditions of the network are supported by all the static computation modules.
Data conversion
The Data Conversion module enables to convert data from IEEE or PSS/E (v33) formats to SMART FLOW format. Most of the standard models from the PSS/E standard model library are converted, as well load flow and dynamic data files.
Single-line diagram editor
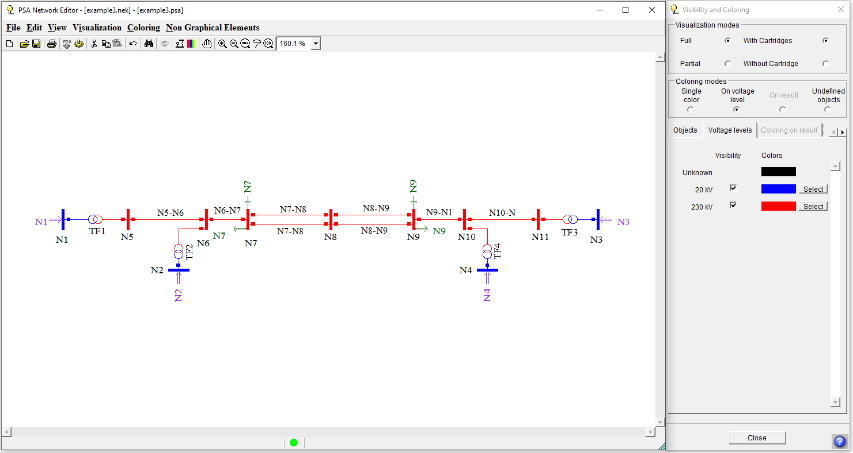
The Network Editor allows the user to draw a schematic view of the network, to access the physical data of the main equipment and to run Load Flow Computation.
Single-line diagram edition
The basic element is the electric node. The lines, transformers and coupling devices connect the nodes. Components such as generators, loads or capacitor banks are connected to the nodes.
Accessing physical data
The load flow data (bus, line, transformer, capacitors, etc.) can be directly managed from the one-line diagram: the dedicated displays of the File Editor (see above) are directly accessed, for efficient data engineering.
Running Load Flow Computation or Static Security Analysis for one contingency
The Load Flow Computation can be launched from the One-Line Diagram Editor. The main results (voltages, power flows, etc.) are automatically displayed on the diagram. Their selection and colouring are customizable.
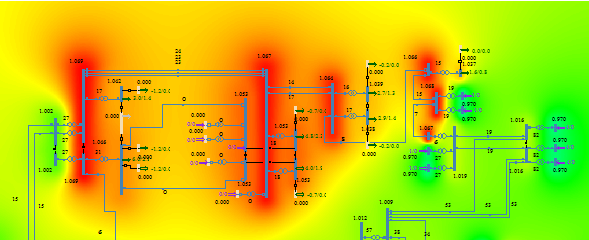
Heat map
Many others functionalities are available in the Network Editor as displaying results on several synchronized graphical schemes, displaying EUROSTAG, IPSO or SHOCC results or presenting a heat map based on the nodes or branches results.
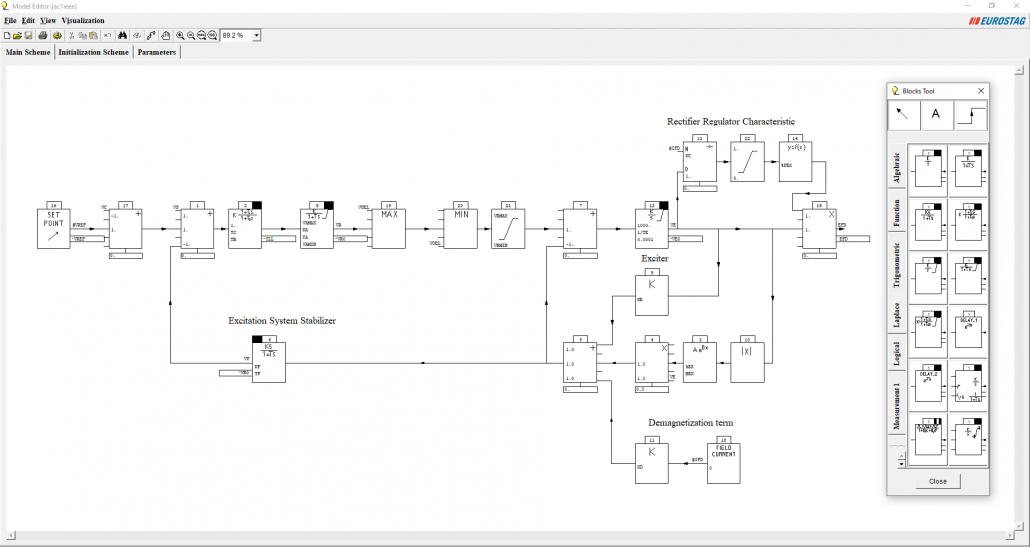
Interactive graphic User-Defined Dynamic Model Editor
The Model Editor enables the user to avoid FORTRAN coding when creating user-defined dynamic models, called “macroblocks”. In the first stage of the macroblock description, the block diagram of the model is built up graphically and in an interactive way by means of a catalogue of elementary blocks (summer, relays, time constants, etc.).
The topology of the diagram is then given. Finally, the parameters and initial values are defined by either numerical values or by a second (algebraic) block diagram which is only solved during the initialization phase of the simulation.
Post-processor

The graphic Post-Processor makes easier both the interpretation of results and the editing of reports. Zooming, curves comparison, superposition, change of scales, etc. enables a spontaneous approach of the result analysis. Any variable can be plotted (e.g., it is possible to look at all the elementary block outputs, without needing to a priori declare which variables will be observed).
However, the size of the output files is not large because state variables are the only variables to be stored. All other quantities are automatically re-calculated by the Post-Processor as a mathematical combination of the state variables.
Some additional features, such as graphical command files, allow important time savings. They replace repetitive tasks: the sequences of commands are recorded when applied to a given case and can be automatically replayed on another case.
IMPORT functions are provided to compare EUROSTAG® results with external quantities such as measures, results of other programs, etc.
EXPORT functions allow transferring EUROSTAG® results into spreadsheets and COMTRADE files.
User-defined tabular and curve output
A dedicated module allows the user to get a synthetic view of the results. It generates tables of SMART FLOW results associated to a given time instant or time range, or graphical command files allowing to plot sets of curves in the Post-processor. In each table or set of curves, the results of a system component type (node, branch, generator, motor, etc.) are given for a list of these components. This list is built by the user through specific filters which are based, for instance, on critical thresholds.
The user can access all types of simulation results, including interface variables, macro-language block outputs, free attributes of all equipment, reference frequency at node, active and reactive losses on the branches, rated current on the branches, area of the node connected to a generator, the active and reactive power of the banks, etc. All asymmetrical quantities are also available. Mathematical operations are possible, and output in ASCII format can be used in spreadsheets.
This tool allows an easy and fast processing of large sets of simulation results. It applies to both static and dynamic simulation results.

Batch Tool
When repetitive sequential calculations using several modules of SMART FLOW are required, they can be defined in a simulation sequence via the Batch Tool. These calculations can be launched in a batch mode and automatically performed without the need for user interaction.